The R91 Dispersion Code
Introduction
The R91 model (NRPB-R91) is a "gaussian plume model" of atmospheric dispersion.
This model assumes, among other things, that the radioactivity, in the form of gas or dust, spreads out in a Gaussian form in the vertical direction, until impeded by the ground or a reflection boundary in the atmosphere and horizontally without constraint and is claimed to be reasonably accurate between about 100m and a few 10s of kilometres downwind. Importantly it is claimed to be more accurate at estimating the peak ground concentration than it is at identifying exactly where that will be. This makes it better for estimating how far downwind a particular dose threshold will be exceeded for a particular source term (useful for emergency planning purposes) than for tracing the dispersion of radioactivity on a particular day (which woudl be useful for formualting advice on teh day of an accident).
The good thing about this model is that it is very easy to understand and it can be coded into a computer program or spreadsheet with comparative ease. Since the parameters have been chosen to fit experimental data and the predictions of more detailed models it is adequately accurate for many purposes.
If you know the effective release height and the weather conditions expressed as pasquil weather category (the R91 paper explains the pasquil categories), wind speed and wind direction then you have the information you need to model the dispersion. Further parameters such as inversion layer height and ground roughness improve the modelling at the price of complexity. Simple models, based on wind tunnel experiments, are also available which allow you to take account of building entrainment.
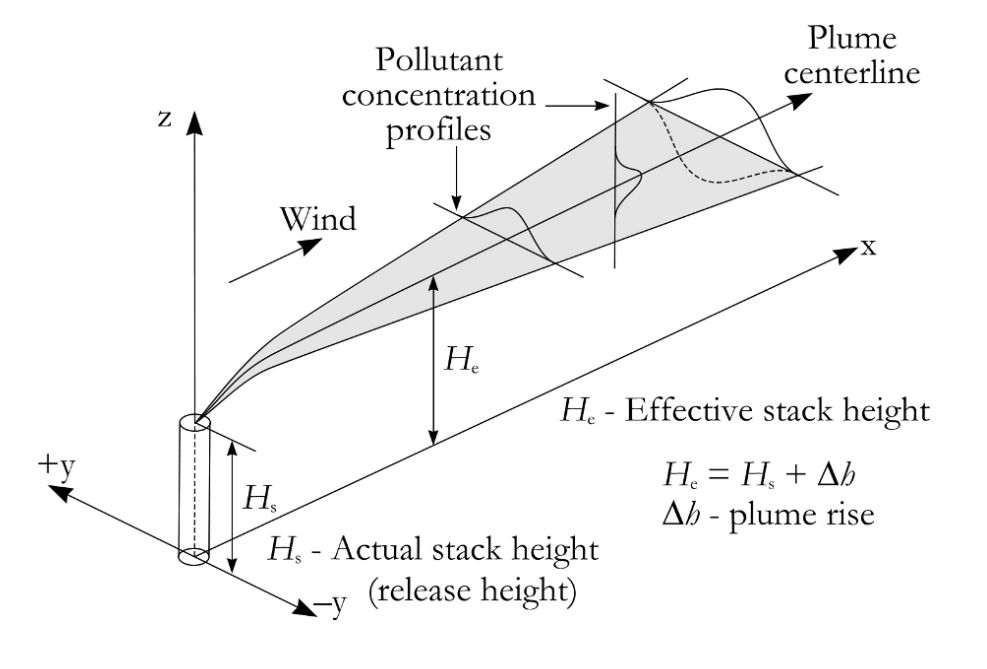
Figure from: Leelossy, Adam & Molnár, Ferenc & Izsák, Ferenc & Havasi, Ágnes & Lagzi, István & Mészáros, Róbert. (2014). Dispersion modeling of air pollutants in the atmosphere: a review. Central European Journal of Geosciences. 6. 257-278. 10.2478/s13533-012-0188-6.
Within the R91 model the concentration at a point x (m) downwind, y(m) cross wind and z(m) above the ground is given by:
C(x,y,z) = Q / (2π.u10.σz.σy) . exp {-0.5 . [(y2/σy2) + ((z-h)2/σz2)]}
where
C(x,y,z) Concentration at point x,y,z (Bq.m-3)
Q Source term (Bq.s-1)
U10 Wind speed (m.s-1) at 10 m height
σa Standard deviation of plume in direction a (m)
H Release height (m)
The vertical cloud standard deviation (σz) at a given distance from the source is a function of the atmospheric stability, downwind distance and ground roughness. The dispersion of the plume in the horizontal plane is the result of turbulence processes together with fluctuations in wind direction which can be treated as independent processes. The R91 paper explains how the two values can be obtained.
The R91 model is calibrated based on data for very short releases and is considered to give an upper bound for average concentrations for longer releases. A method for accounting for release durations of greater than 30 minutes is given in the original report.
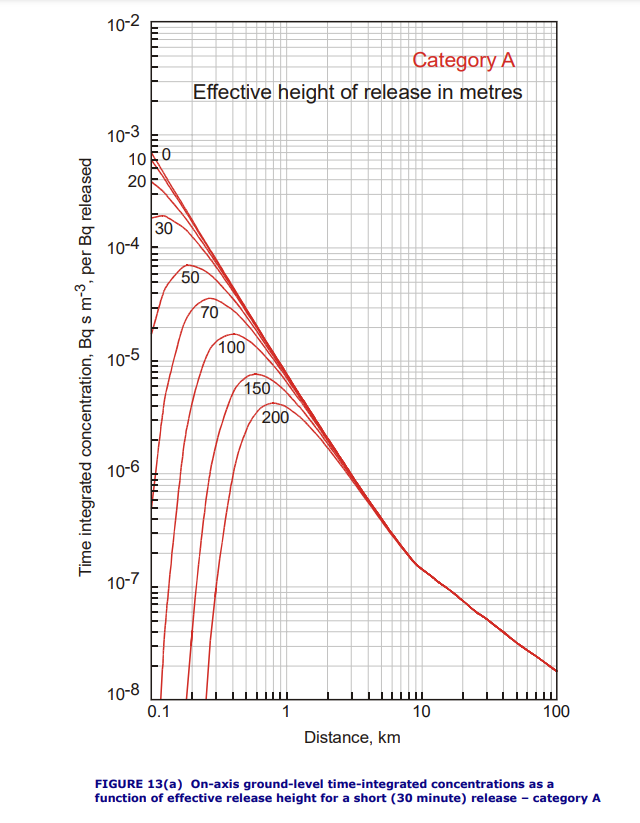
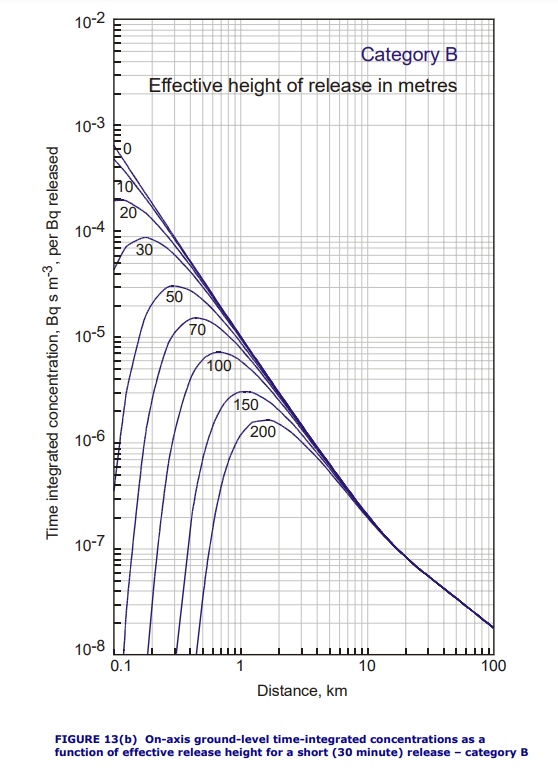
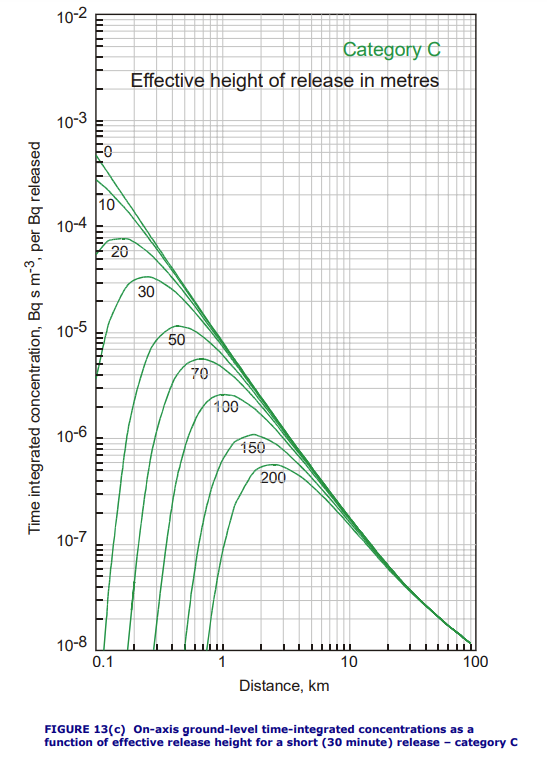
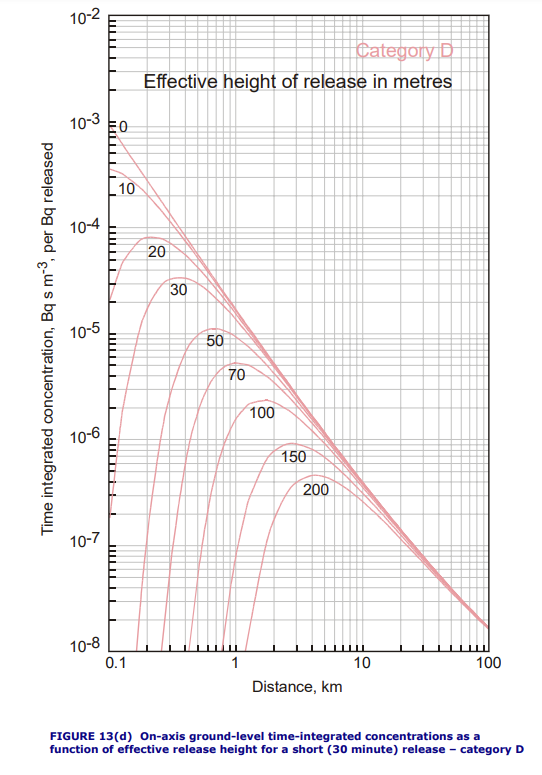
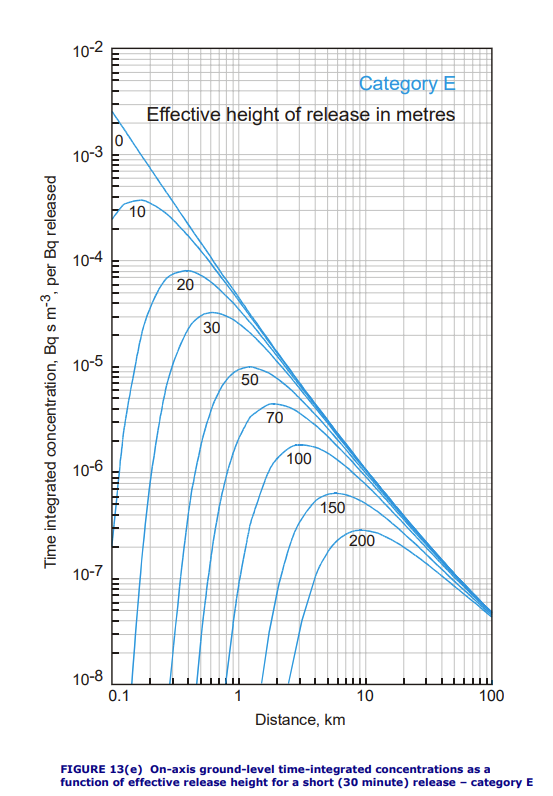
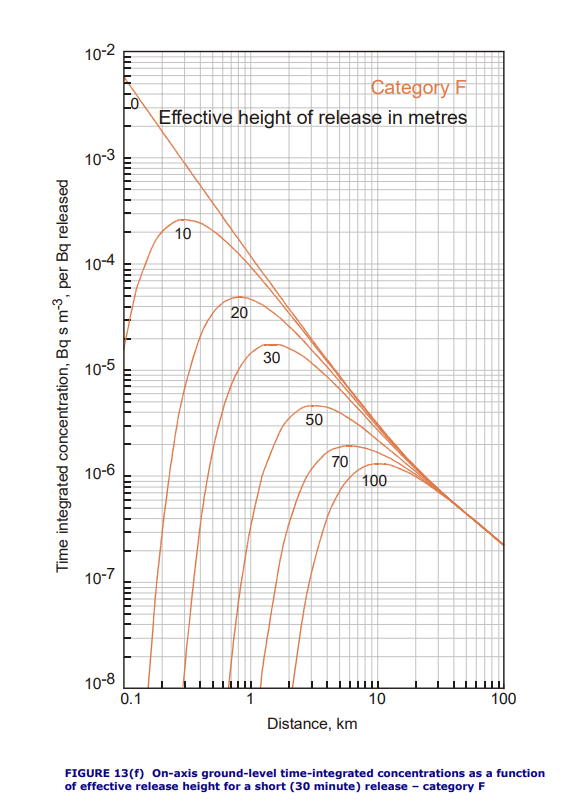
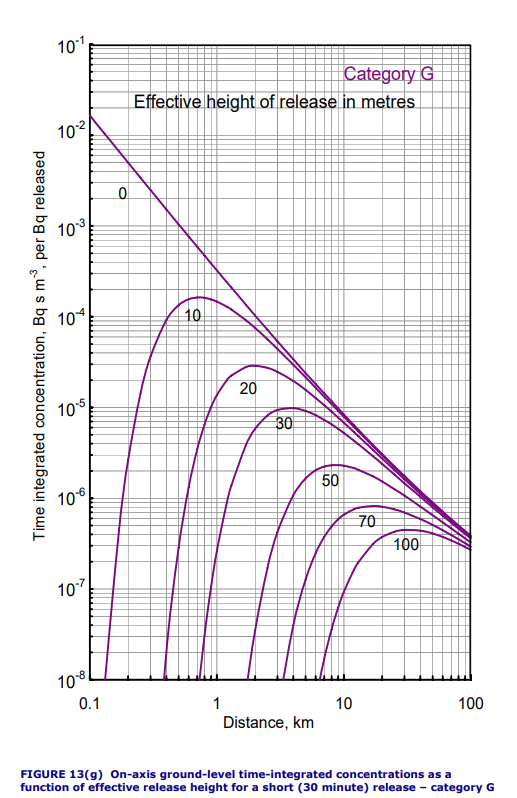
Gallery of R91 dispersion as a function of weather category and release height. All figures from NRPB-W19.
The Y axis of these graphs reports a variable often called “the dilution factor”. This can be understood as the airborne concentration (in Bq.m-3) that would result at a point downwind from a uniform release of 1 Bq.s-1 under unchanging conditions or the Time Integrated Air Concentration (TIAC) (Bq.s.m-3) at that point resulting from a release of 1 Bq. TIAC is a very useful starting point for dose estimates.
For off-axis locations the methodology provides scaling factors which predict how rapidly the airborne concentration drops off with off-axis distance.
The methodology as presented here ignores a number of factors. These include:
- Deposition, where some of the radioactivity in the plume drops to the floor or sticks to surfaces such as walls, trees, crops etc. For heavy particles this is a quick process and they tend not to travel far. For noble gases it is negligible and they disperse downwind with dilution but without deposition loss;
- Building entrainment. The simple model does not take account of the effects of buildings on the wind direction and wind turbulence. These effects can be approximated by extensions to the models as shown in further papers published by the Atmospheric Dispersion Working Group.
- The effects of plume rise. If the discharge is hotter than the ambient air, is moving relative to it or is a different density then the dispersion will be affected. Again this can be modelled with improvements to the simple model.
Some more modern models (Such as ADMS) are better at including these effects at the expense of increased complexity and decreased transparency.
Codes such as the Met. Office NAME which use different principles, are better at greater
distances and at predicting when a plume will arrive at a point downwind but, again, at the cost of increased complexity and increased data requirements
(including 4D wind fields) (Ref).