Outlying weather conditions

It is common to assess the potential impact of a particular incident at a nuclear power station by estimating a source term for the event and then repeatedly running the source term through an atmospheric dispersion code with different weather conditions to provide a statistical distribution of off-site doses or other impacts.

Met data can be obtained from a variety of sources. These include local observations, nearby (or not so nearby) observations, or synthetic data obtained from the massive weather forecasting and recording models and databases. With improvements in the recording of weather data, synthetic data is increasingly seen as the better option.

Methodologies might run the dispersion code for each line of met data available or may sample the data to reduce computing costs/times but in the hope of the results remaining representative.

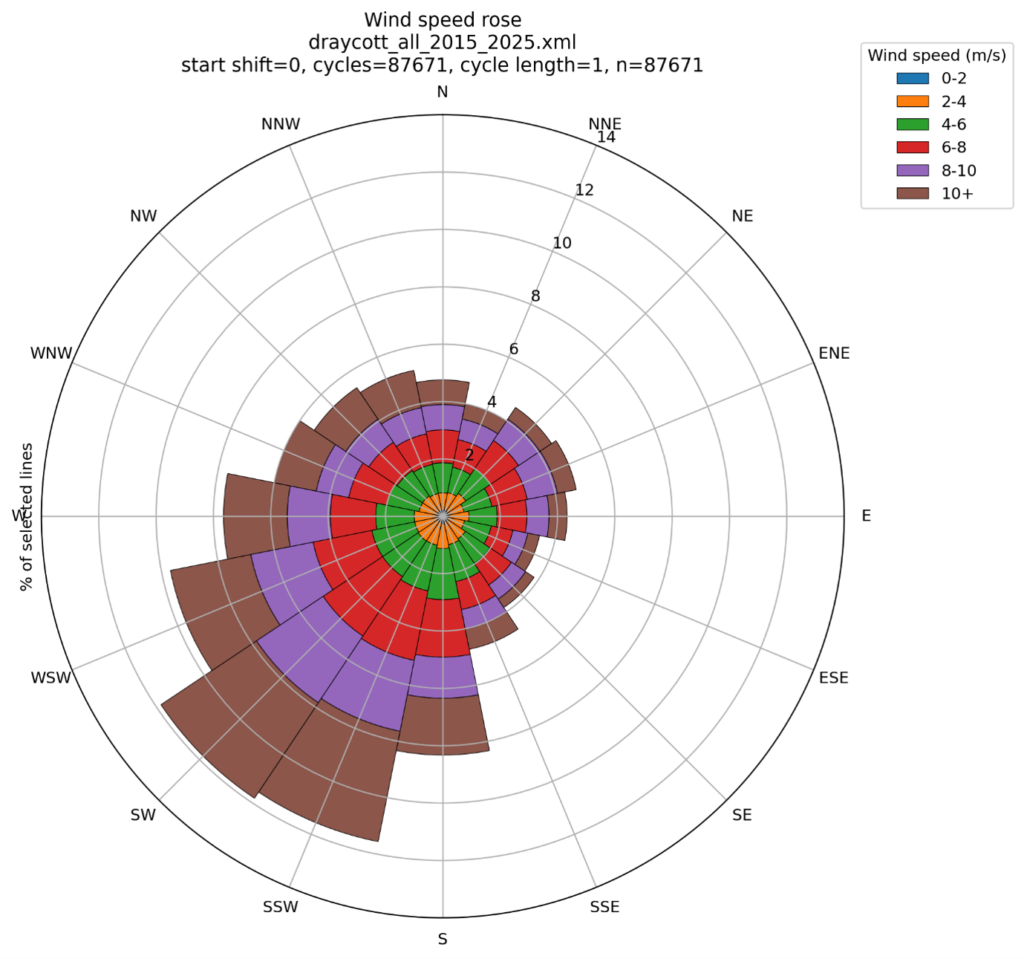
ERA5 met data were collected from the Climate Data Store at https://cds.climate.copernicus.eu/datasets/reanalysis-era5-single-levels?tab=download for a node at (103.75E, 1.25N) for the full period 2015 – 2025 and used to deduce the stability category.  

The resulting wind-speed rose is shown below.
and the wind direction frequency below:
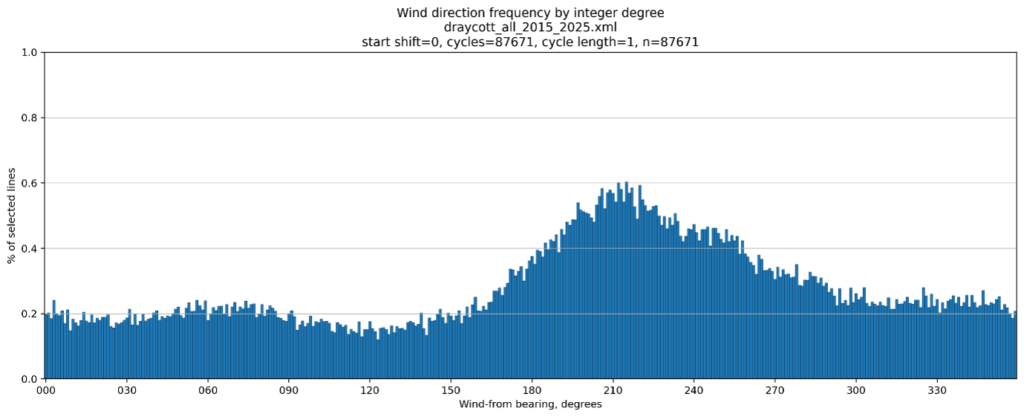
What this presentation fails to show is the outlying sequences, met sequences that might be expected to cause high doses further downwind than usual. These include sequences with very low mixing layers and sequences with very low wind speed (see table)

SequenceMix Layer/ mCatWind speed/ m/sRainfall
180216F0.410
180314E0.190
180417E0.490
260885B0.110
2698457B0.450
2699268B0.50
2700312B0.170
392142B0.40.317
3951129B0.350.05
4090221B0.030

One of these (1802) is for a wind direction of 92 degrees. The figure below shows the dose as a function of downwind distance estimated using the ADEPT R-91 type dispersion code in the PACE model (https://www.ukhsa-protectionservices.org.uk/pace) calculated for all angle with a 92-degree wind direction with sequence 1802 highlighted.
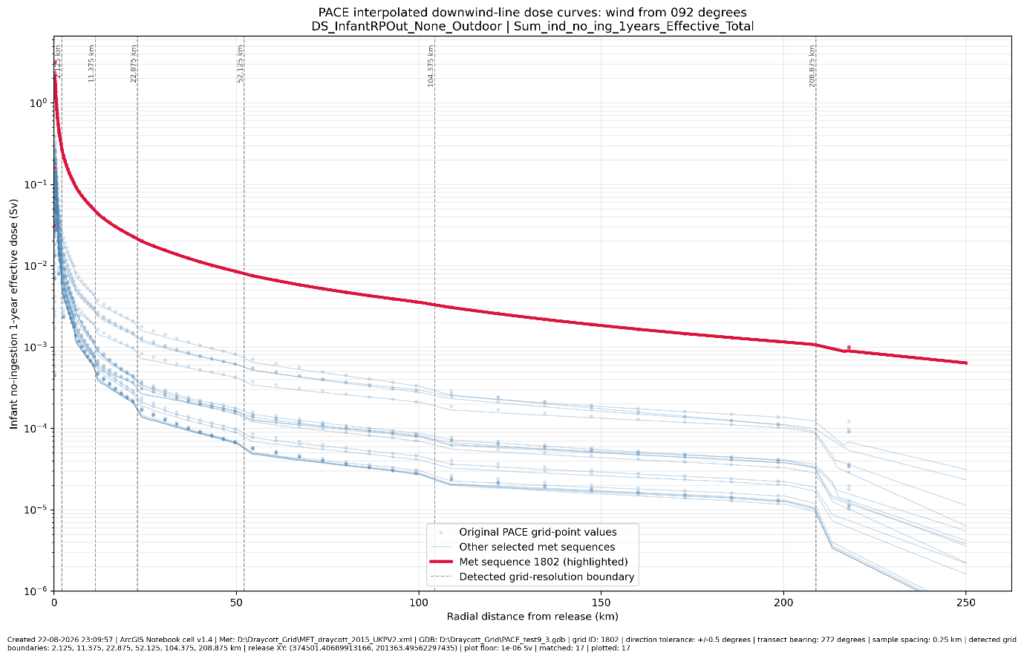
This plot highlights a minor issue with the impact of a change in grid sizes and an issue with the linear interpolation I used to determine the dose at the downwind point of interest (PACE works on a grid rather than your chosen array of points). But it makes the point; there are weather conditions that may produce very different dispersion patterns.

This poses the question “should our emergency planning zones (assuming the source term is accepted as appropriate) be based on the average downwind distance for an exceedance, a high percentile (P95, P98, P100) of the downwind exceedance, or an exceedance by the average dose or a percentile dose at a particular distance”?

UK guidance is to use P95 which should eliminate these outliers (unless your random sample picks up too many of them).

Emergency planners should be aware that an accident could happen on a particularly cold night with very low wind speeds and, if it does, actionable radiation doses might extend much further than expected.

Of course, they might not. With these low wind speeds the penetration of the plume will be very sensitive to deposition (the assumption above is vg=1E-3 m/s) and to changes in the wind speed and direction. Not a good night to depend on your default arrangements or your dispersion code.
ARGOS – A decision Support system and more

I listened to a presentation on the ARGOS (Accident Reporting Guidance and Operational Support – https://pdc-argos.com/index.html) decision support system today (25/08/26).

Their website tells us that ARGOS is useful throughout the entire disaster life cycle:

  • During the Preparedness phase for planning, dimensioning and training – including evaluation of various ‘What-if’ scenarios
  • During the Response phase by calculating prognoses about how the situation will evolve; what can be the consequences of the dispersion; what the proper emergency or evacuation zones are; etc.
  • During the Recovery phase; what will be the effect of applying possible countermeasures; etc.
  • In the Evaluation phase to study what could have been done better and how could the situation have evolved?

The code is based on the RIMPUFF atmospheric dispersion modelling code (https://inis.iaea.org/records/2mgb1-mfy59) but also has a model optimised for short urban distances (URD – useable for on-site doses, urban dirty bombs and chemical releases).

The code is available from PDC-Argos in Denmark.

Tracing back to 1986 (following Chornobyl) the code has been constantly maintained and updated, new features have been added.

It has customers through out the world.

Its role as a decision support system is to predict where a radioactive plume will go and estimate the projected doses and avertable doses given a possible suite of protective actions.

On the simple interface you pick a location, a source term and a start time from pull down menus (you can add your own site locations and source terms).

You can have up to 1000 release points all with their own source term and time structure.

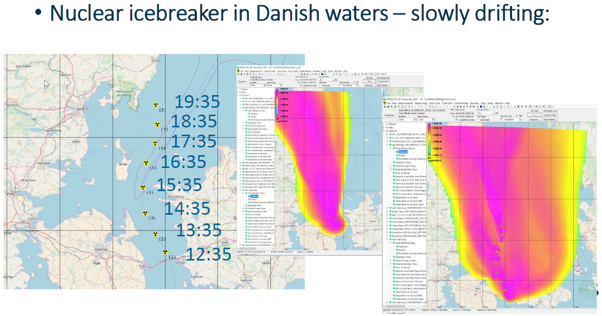
You can model moving sources (see below) which is novel but, with the trend to build floating SMRs and nuclear powered shipping, potentially useful.


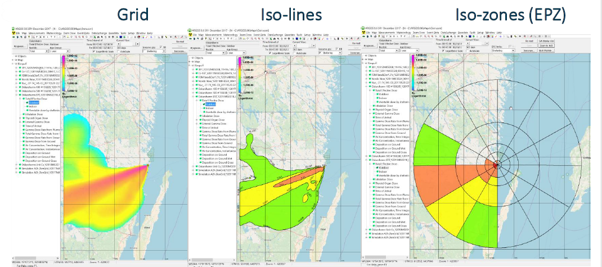
There are various output formats:

You can input data from permanent monitoring stations (including EurDep) , or manual measurements. It is not clear it me how these relate to the dispersion modelling but nonetheless it can be valuable to have measured data and predicted results in the same place.

It does food chain modelling, but to set up for a new region would be a significant amount of work. This allows you to predict where crops may exceed thresholds and for how long that situation would pertain.

You can investigate food countermeasures and land remediation.

You can investigate other dose pathways and how they might vary with time.

You can also now set it up to undertake continuous calculations – automatically work through a whole library of weather data and export to spreadsheet for a statistical analysis of the dose end points.

Automatic running also allows you to have periodic (daily or hourly maybe) predictions of plume arrival times for different source locations.

This seems like a good code to have available in national response centres linked to the national meteorological centre and the national fixed monitor grid, preloaded with NPP locations and a library of sources terms from the safety cases of each. You would then need a skilled operator or two to update the data being fed into the model and interpreting the results and decision makers familiar with the output and the radiological implications of an airborne plume.

The initial role would be radionuclide plume footprint and arrival times (where to apply protective actions), followed by avertable dose as a function of time – checking protective action advice to confirm that it is of sufficient initial extent and is withdrawn in a timely manner.

If you use the code in the planning stage to determine how big the emergency planning zones should be under different circumstances you would gain valuable experience in setting up the code and running it.

It can also be used in exercises, generating off-site radiological conditions for the umpire’s side and modelling the release footprint, arrival time and dose implications for the players.

A useful code for a national response body and a nuclear utility to consider.